Top of bedrock defines the bottom of the soils or unconsolidated unit. Depth to bedrock is generally the same as the soil thickness. Undoubtedly, the top of the soil unit is easy to place. It is ground level. However, defining the top of rock is sometimes problematic. First, the top of bedrock is not something you can see without excavating unless it is exposed at the surface. Second, the top of bedrock is often weathered, chemically altered, and fractured. In addition, boulders or blocks of stone above the bedrock surface are sometimes mistaken for top of rock. In the same way wetland delineations require a trained eye to estimate the boundaries of a wetland, mapping the top of bedrock requires experience.
Defining what is the top of bedrock is not an exact science as one will find out.
In real life, one does not always see a clean surface, especially when characterizing the Silurian bedrock surface. The surface can range from solid rock to a form that appears almost like a sand and gravel. The end result of identifying the top of weathered rock or the depth to a competent bedrock surface is problematic though potential equally bad for bedrock verification. For example, mapping the top of weathered bedrock yields shallower depths than mapping the depth to a competent bedrock surface. On the other hand, if one maps the depth to a more competent bedrock surface than the soil analysis will likely need to increase the amount of course grained soils (sand and gravel content). Increasing the amount of sand and gravel could change the soil texture classification identified in NR 151. To illustrate, here are some definitions of bedrock. The definitions are straightforward.
Wikipedia
Per Wikipedia, “In geology, bedrock is the lithified rock that lies under a loose softer material called regolith at the surface of the Earth or other terrestrial planets. The broken and weathered regolith includes soil and subsoil. The surface of the bedrock beneath the soil cover is known as rockhead in engineering geology,[1][2] and its identification by digging, drilling or geophysical methods is an important task in most civil engineering projects. Superficial deposits (also known as drift) can be extremely thick, such that the bedrock lies hundreds of meters below the surface.[3]”
Natural Resources Conservation Service or NRCS
From www.nrcs.usda.gov Bedrock is defined as – A general term for the solid rock that underlies the soil and other unconsolidated material or that is exposed at the surface.
United States Geological Survey or USGS
USGS defines Bedrock as “The solid rock that lies beneath soil and other loose surface materials.”
Geology.com
They define Bedrock as “Solid rock present beneath any soil, subsoil, sediment, or other surface cover. In some locations it may be exposed at Earth’s surface.”
NR 151 requires infield bedrock verification.
While time will tell, I am curious to know if the current available data is adequate. In addition, limited research suggests that there are not apparently any reports to date that confirm what is the acceptable level of effort for bedrock verification. This is not a surprise and possibly premature to think otherwise since the regulations went into effect June of 2018. It is likely a staggering task to implement this regulation given the difficulties of monitoring a program that covers these Wisconsin counties: Brown, Calumet, Dodge, Door, Fond du Lac, Kenosha, Kewaunee, Manitowoc, Milwaukee, Outagamie, Ozaukee, Racine, Sheboygan, Walworth, Washington, and Waukesha.
Why did defining the top of bedrock become important to Wisconsin agricultural facilities?
First, the US EPA set a performance standard for total maximum daily loads or TMDL. It states, “A crop producer or livestock producer subject to this chapter shall reduce discharges of pollutants from a livestock facility or cropland to surface waters if necessary to meet a load allocation in a US EPA and state approved TMDL.” Subsequently, Wisconsin created its state approved TMDL as part of NR 151, which requires infield bedrock verification. As a result, an infield bedrock verification survey designates the Silurian bedrock maximum liquid manure application rates with respect to soil texture (e.g., Sand, Sandy Loam, Loam, Silt Loam, Clay Loam, and Clay). Consequently, agricultural facilities, depending on their location, must map the top of the Silurian bedrock.

Restrictions are established by EPA and Wisconsin DNR.
NR 151 defines “Infield bedrock verification”
NR 151 states that one needs to determine rock depth using available data. Methods include well construction reports, location of drill cores or other subsurface investigations, location of quarries and natural bedrock outcrops, geophysical investigations, and uneven crop growth patterns that are linked to fracture traces in the field. It notes that other acceptable “available data” includes construction reports, drill cores, locations of quarries and rock outcrops. Currently NR 151 states that “Note: Silurian bedrock map information developed by the department of agriculture, trade and consumer protection and/or department of natural resources, may be used alone or in combination to meet the requirements of this section. Note: Silurian bedrock map information, available from the University of Wisconsin department of soil science, can be found at https://snapplus.wisc.edu/maps/.”
Currently approved maps from SnapPlus.
The overlays at SnapPlus showing soil thickness are currently accepted for bedrock verification. This approach of infield bedrock verification, which is state-of-the-art and a valuable interface between state government and agricultural facilities, may fall short for two reasons. First, from the agricultural facility’s point of view, the maps may overestimate the amount of area that is restricted. From the US EPA’s or DNR’s position, the maps may overestimate the amount of area that is less restricted. Unless one can see the locations of the data for creating the SnapPlus maps, it is difficult to assess SnapPlus’ limitations. So far, the only clue available is its disclaimer, which states:
SmapPlus’ Disclaimer:
This map is provided solely as an initial inventory of nutrient spreading risks for nutrient management planning. It must be field verified to identify additional risk areas such as conduits to groundwater and concentrated flow channels. The Department of Agriculture, Trade and Consumer Protection and University of Wisconsin do not guarantee the accuracy, the applicability for a particular use, the completeness, or the legality of data provided by other sources. No warranty, expressed or implied, is made regarding the accuracy or utility of information depicted on this map.
This disclaimer makes it difficult to know if using SnapPlus is meeting the intent of the US EPA’s standard or not. By no means, is this a reflection upon SnapPlus since it simply displays maps using readily available technology to define the top of Silurian bedrock.

Making contour maps of the top of bedrock is difficult with limited amounts of data.
Case history of a hydrogeological characterization.
Interesting details about bedrock mapping came from the Hydrogeological characterization of the Town of Lincoln, Kewaunee County, Wisconsin … Open-File Report 2017-05. The report focuses on mapping the susceptibility for groundwater contamination. It factors in the depth to rock, type of rock, groundwater recharge rate, and depth to the water table. These factors are rated from one to five and then totaled. The total is an “informational and educational tool” for identifying areas that have moderate susceptibility, high susceptibility, and the highest susceptible for groundwater contamination. While there is much more to discuss the in-depth study took great effort. In my opinion (needs verification), I am assuming the study was commissioned because other currently available data was insufficient. Unlike other available resources, I am assuming that this study is more robust and conclusive than all other available data and maps. Otherwise, there would be little point of conducting the study.
From 2015 through 2017, the study integrated between five hundred and one thousand data points (my best estimate). This rigorous investigation combined logs from hundreds of wells, excavations, geophysical surveys, groundwater studies, and previously constructed maps. Surely, I suspect this is one of the most comprehensive studies conducted within the list of counties presented in NR 151. Even so, the study states that “The maps should not be used as the sole criterion for making siting or land-use decisions. Site-specific decisions should always be made using site-specific information.” Consequently, it seems this level of effort and resolution is not likely great enough to provide infield bedrock verification. At least not to the level of detail that meets the intent of NR 151.
How do we determine the top of rock?
If SnapPlus and hydrogeological surveys like the one for the Town of Lincoln have disclaimers, then where can we go from here? Like many surveys pertaining to the outdoors (e.g. wetland delineations, wildlife inventory, and the weather), there are data requirements to support various conclusions. These conclusions have various levels of confidence. To illustrate a high level of confidence, if one looks outside and sees rain, it is raining. Likewise, a casual observer walks across a field and sees large areas of exposed rock that is bedrock then there is little to no soil. However, other portions of the field covered by soil are more difficult to determine the depth to bedrock.
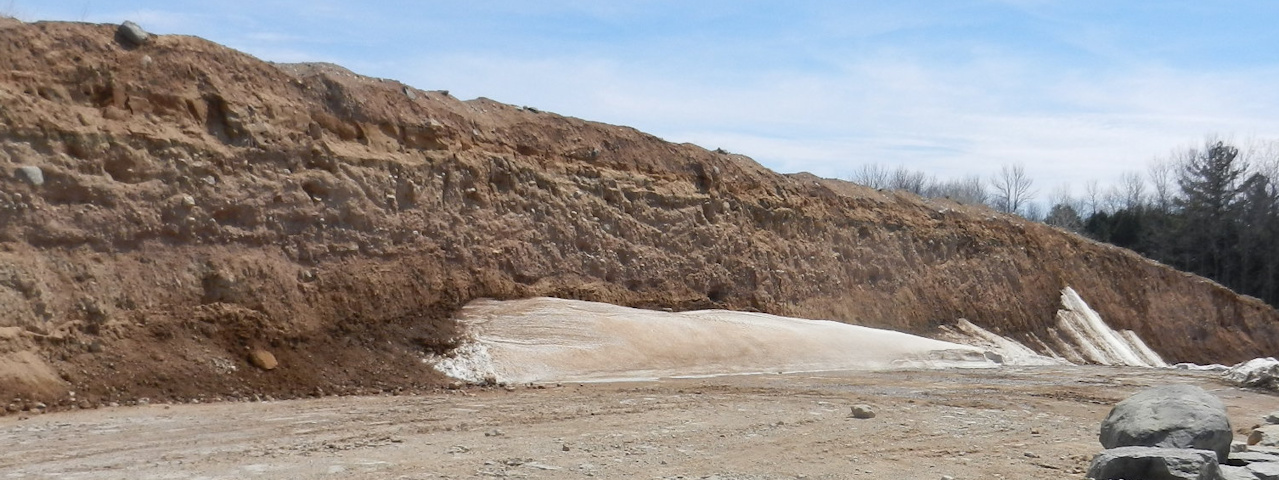
Bedrock is exposed after about 15 feet of soil is removed from the top of the Silurian bedrock near Green Bay WI.
Frequently the following methods are good for determining the depth to bedrock but have limitations. Site-specific infield bedrock verification likely requires much greater resolution than current maps or existing well reports have to offer:
Current maps
While current mapping technology and data are good on a large scale, it is not likely acceptable for making site-specific decisions as mentioned in the case history. Until now, higher resolution bedrock maps were of little use, which is there are few to be found.
Existing well logs
Well construction reports are a valued resource. The state’s database is enormous and allows one to map trends over very large distances. However, depending on the expertise of the person filling out the reports, one may find discrepancies. Wells are frequently located within thousands of feet from the true location, soils are defined using ambiguous terms, and accurate depths to within a foot are questionable. To repeat, any maps generated using this data may not lend itself to a site-specific bedrock verification program.
Drilling, trenching, and other direct observations
Drilling is very accurate until one encounters boulders, lateral variations in soil profiles, fractures or faults, karst environments, or localized bedrock depressions or valleys. With widely spaced borings, many of these situations may improperly map areas that are approximately tens of acres in size. More closely spaced drilling or trenching methods can get expensive. The solution entails methods that can cover spatially large areas with better horizontal resolution or mapping capabilities.
Geophysics
The greatest draw back with geophysical methods is the lack of direct observations. Interpretations are made about the results and conclusions are drawn. Conversely, there are very few other methods available to characterize large areas (hundreds of acres) with great resolution. Vertical resolution is commonly less than ten percent of the depth. The horizontal resolution is on the order of feet or tens of feet. When geophysical results are correlated or ground truthed with good drilling or trenching methods one can expect site-specific cost effective results.
Conclusion
In conclusion, we have definitions for bedrock and we know how to measure depths. The only remaining question is how do we know when we encounter bedrock so we can measure the depth. As we can see from above, there are various methods for mapping bedrock. The accuracy of the vertical and horizontal resolution is directly proportional to the amount of data. Maps generated with sparsely spaced data points may not interpolate well between data, which is, to some degree, misleading. Thus, to meet the US EPA’s intent and Wisconsin’s NR 151 program, I feel site-specific services are a necessity. Site-specific services benefit the agricultural facility by potentially redefining large tracks of land to a less restrictive classification. On the other hand, the state benefits by obtaining reasonable confirmation that farm fields are not understated and potentially exceeding the US EPA’s performance standard for total maximum daily loads or TMDL.
As groundwater quality programs expand beyond biological threats tied to nutrient management programs and more aggressively transitions into groundwater chemistry, emphases will likely be put on soil classifications and bedrock topography. By all means, there are great benefits in more detailed mapping of bedrock. Greater detail can lead to the better mapping of fracture systems, faults, karst features, and bedrock depressions or low spots. Bedrock depressions are likely a great concern. Large volumes of groundwater are naturally pooled or stored below the surface for future use. If bedrock depressions are contaminated by surface water infiltration through course grained materials, major groundwater resources can be compromised.

Example of soil covering top of rock.


