Cost is the bottom line for many people. Unlike large agricultural facilities, it is generally more expensive to map bedrock for engineering projects. For example, smaller sites (e.g., less than twenty acres) are less cost effective. The price per acre for geophysical surveys starts to drop with larger scale agricultural applications. Parcels greater than forty acres or locations where bedrock is greater than about fifteen feet likely cost less per acre than smaller sites. For decades, farmers and agriculture consultants are familiar with mapping apparent conductivities to evaluate very shallow soil conditions using a Geonics EM38. Mapping bedrock with other geophysical methods is not much different. Today in Wisconsin, NR 151 code defines “Agricultural Performance Standards and Prohibitions.” These revised regulations are driving the agricultural community to embrace a larger suite of geophysical methods. Though many factors are discussed, one paragraph states that “infield bedrock verification” is required.
Definition of infield bedrock verification indent this paragraph
NR 151 states “(8h) “Infield bedrock verification” means determining bedrock depth using available data which may include well construction reports, location of drill cores or other subsurface investigations, location of quarries and natural bedrock outcrops, geophysical investigations, and uneven crop growth patterns that are linked to fracture traces in the field.”
What drives the cost of a geophysical bedrock mapping survey?
The definition for infield bedrock verification gives us some clues and methods for satisfying the code requirement. In other portions of the law, restrictions vary depending on the depth to rock. The breakdown is less than two feet, two to three feet, three to five feet, five to twenty feet, and greater than twenty feet. Currently, the code does not have restrictions for bedrock greater than twenty feet. Geophysically, the level of detail and the type of geophysical methods will drive the cost for a given site. Without doubt, the level of effort and cost is site dependent. Unless one is simply looking to differentiate between shallow and deep bedrock, mapping variations in soil thickness less than five feet requires greater effort. To avoid misleading results, one should pay close attention to the amount of geophysical data collected both horizontally and vertically.
First investigate currently available data.
Other acceptable “available data” per NR 151 includes construction reports, drill cores, locations of quarries and bedrock outcrops. Currently NR 151 states that “Note: Silurian bedrock map information developed by the department of agriculture, trade and consumer protection and/or department of natural resources, may be used alone or in combination to meet the requirements of this section. Note: Silurian bedrock map information, available from the University of Wisconsin department of soil science, can be found at https://snapplus.wisc.edu/maps/.”
While these maps are currently accepted and a good first order approximation, the spatial resolution or detail may exceed the amount of data available to create the maps. Frequently, one can observe contour lines or layers that show features on the order of fifty to 100 feet in width. Mathematically this implies data or observations are available on the order of twenty-five to fifty feet apart for a high level of confidence. Conversely, large areas with little detail may have regions that are over generalized by local trends. Geophysical methods may assist with reclassifying or better defining these areas. Because of the possibility of under sampling, the inaccurate placement of wells frequently found in well construction reports, and the different methods for describing geologic units, the following disclaimer must be accepted before accessing SnapPlus.
SnapPlus’ Disclaimer:
This map is provided solely as an initial inventory of nutrient spreading risks for nutrient management planning. It must be field verified to identify additional risk areas such as conduits to groundwater and concentrated flow channels. The Department of Agriculture, Trade and Consumer Protection and University of Wisconsin do not guarantee the accuracy, the applicability for a particular use, the completeness, or the legality of data provided by other sources. No warranty, expressed or implied, is made regarding the accuracy or utility of information depicted on this map.
Survey layout.
For agencies to feel confident, the geophysical results must reasonably reflect field conditions at depth. Thus, there needs to be a sufficient amount of data. The amount of geophysical data necessary to generate maps is dependent on the depth of interest and the desired horizontal and vertical resolution. Above all, note that the regulatory agencies will have the final say. Hopefully, the geophysical methods, sampling, and interpretation suggested in this discussion meet their needs for infield bedrock verification.
Horizontal resolution.
Horizontal or lateral resolution requirements are driven by the size of the smallest area one wishes to delineate. If one owns two hundred acres and needs fifty acres in an area with bedrock greater than ten or twenty feet, then lower lateral resolution may be appropriate. However, if one needs one hundred and fifty acres in a marginalized area known for shallow bedrock, a higher resolution approach is usually necessary. Without direct input from any agencies, the following discussion offers some potential insight. This may change in the near future with feedback from those enforcing the infield bedrock verification program.

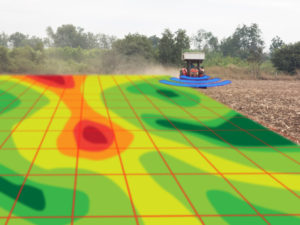
A contour map for mapping bedrock requires traverses not too far apart.
Bedrock deeper than twenty feet.
For areas where acceptable available data defines bedrock as greater than twenty feet, there is little need to conduct any type of investigation. These areas are not part of the scope for bedrock verification. Thus, cost is not an issue for these areas.
Bedrock five to twenty feet deep.
For areas where available data defines bedrock as greater than five feet and less than twenty feet, there is a benefit for conducting additional tests. If one can demonstrate the depth to bedrock is greater than twenty feet, there does not appear to be any bedrock restrictions. Furthermore, the cost for conducting lower resolution surveys for deeper investigations is frequently less.
Unless there are extreme variations in the depth to rock over short distances, I propose that a large line spacing is likely appropriate. While closer line spacings may improve the resolution or level of detail, it is not likely worth the extra cost. Depending on an agency’s position, transect lines spaced two hundred feet or more apart may yield desirable results. It is easy to imagine the placement of lines two hundred feet apart given that a square acre is 208.7 feet by 208.7 feet, lines two hundred feet apart roughly pass through an acre once. However, the station spacing of the data along a line is often much smaller (e.g. sometimes less than ten feet apart). If data varies more than expected along a transect line, it may be an indication that transect lines should have an average spacing closer than two hundred feet apart.
Bedrock between three and five feet deep.
For areas where available data defines bedrock as greater than three feet and less than five feet, there are additional benefits. As a minimum, if one can demonstrate that bedrock is greater than five feet there is a significant increase in the application rate. Better yet, if one can place the bedrock deeper than twenty feet, there may not be any bedrock restrictions.
I suspect this more restrictive definition will require more closely spaced transect lines. Undoubtedly, a one hundred foot line spacing yields twice as much data as a two hundred foot spacing. In contrast with the two hundred foot line spacing, a one hundred foot line spacing cuts across an acre twice. As in the discussion for bedrock depths between five and twenty feet, the spacing of data along a line is often much smaller (e.g. sometimes less than ten feet apart). One may need to add more closely spaced transect lines if data varies more than expected along a transect line. On the other hand, if the geophysical results are suggesting little variability in soil conditions and depth to rock, one may think about increasing the distance between transect line (e.g. two hundred feet apart or more).
Bedrock between two and three feet deep.
For areas where available data defines bedrock as less than three feet, reclassification may provide two benefits. First, if one can demonstrate bedrock is greater than five feet deep the code may significantly increase the amount per acre. Secondly, the frequency of application for areas with bedrock less than three feet of soil is once a year. Demonstrating a greater depth to rock allows an increase in the frequency of application. Areas with greater than three feet to bedrock are able to apply more frequently (once per week). The cost for conducting shallow high resolution surveys is greater than some of the other options.
This is the most restrictive definition that permits manure application. Given the very shallow depth to rock and potential for possibly mapping areas that are greater than three feet, which greatly improves the frequency of application, a fifty-foot line spacing is not out of the question. A fifty-foot line spacing yields twice as much data as a one hundred foot line spacings and four times the data of a two hundred foot line spacings. Subsequently, an average fifty-foot line spacing, more or less, crosses a square acre four times. Only under unexpected conditions would one likely consider placing lines closer than fifty feet apart. Unlike the two hundred or one hundred foot options, the fifty-foot line spacing is closer in distance to the distance between stations along the line, which is sometimes less than ten feet apart.
Bedrock less than two feet deep.
For areas where available data defines bedrock as less than two feet, there is some great potential for improvement. Currently, the restrictions do not allow access to these areas. Thus, if one can map bedrock as greater than two feet deep over large areas, the plot of land has greater value. Though it is doubtful that bedrock will generally exceed five feet or more in areas identified as less than two feet, one may map a fair amount of land that has bedrock greater than three feet. Areas with bedrock greater than or equal to three feet, can apply once a week instead of once a year. Suggestions for a line spacing to address this category would likely require some preliminary data.
Vertical resolution requirements.
Vertical resolution plays an important role in differentiating depths to bedrock along a transect line. For mapping bedrock, the requirements are likely less of an issue than if one wishes to map karst features, fractures, or faults. Mapping changes in elevation of bedrock for depths less than ten feet is more demanding than for greater depths. While determining the distance between geophysical measurements is often critical for engineering applications or for finding buried tanks, it is less of an issue for bedrock mapping. In short, the distance between lines is often much greater than the spacings between data points along a line. Thus, as long as the sample interval is much smaller than the distance between lines, optimizing the sample interval or vertical resolution is more forgiving then the horizontal resolution requirements.
Vertical resolution is more critical for shallower depths.
1D or 1-D Profiles.
Geophysical data collected along a single line produces a profile. In other words, a single profile is the response from an instrument as one crosses a site. This term does not usually refer to geophysical methods that collect data along a line that presents details as a function of depth. For example, Geometrics OhmMapper configured for a single depth or Geonics EM31 and EM38’s simply reflect lateral variations. The variations across the site reflect a bulk volume of material from an approximate depth of penetration. Frequently, tens or hundreds of lines are collected and combined to produce a 2D plan view representation or map of the data. The point is that the primary vertical constraint is the depth one wishes to investigate. In my opinion, common target depths for infield bedrock verification would focus on less than five feet or approximate depths of ten, fifteen, twenty, or twenty-five feet.
2D or 2-D Presentation of cross-sectional results.
An improvement over collecting profile data is the collection of 2D data. 2D geophysical data collected along a line assists with mapping variations as a function of depth. While one will often observe great detail along a 2D line this approach is seldom cost effective for imaging large tracts of land. Since this discussion focuses on mapping bedrock that is less than twenty or twenty five feet deep, most geophysical methods will not need special attention for optimizing the vertical resolution. Combining 2D presentations of profile data with a select number of 2D cross-sections is a common approach.
Electrical resistivity, multiple OhmMapper configurations, seismic refraction, seismic reflection, multi-channel analysis of surface waves (MASW ), and GPR offer some of the best vertical detail. Unless there are issues with shallow refusal, drilling and borehole geophysical methods will likely provide greater vertical detail than these methods, but only at a specific location. The number and placement of 2D cross-sectional type geophysical methods is site specific. It may also be driven by an agencies input. The issue at hand is that these methods are more expensive when compared to the amount of land they cover.
Costs for geophysically mapping bedrock.
Though the best approach is to contact us for a quote, the following introductory pricing for 2019 (call-currently being revised based on updates to June 2020 standards) may assist with giving a general idea of the costs for geophysically mapping bedrock. By all means, estimated prices are subject to change without notice or as programs evolve. Also, other terms and conditions apply. Please contact us for further details. These estimates are strongly dependent on access, weather, time of year, site conditions, and other unexpected circumstances that can cause delays or limit access.
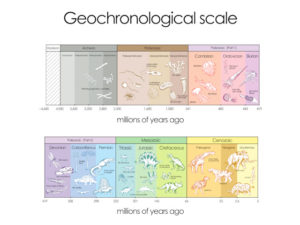
Estimates apply to Silurian bedrock areas defined in WI DNR NR 151: “Silurian bedrock” means the area in Wisconsin where the bedrock consists of Silurian dolomite with a depth to bedrock of 25 feet or less. This area comprises portions of the following counties: Brown Co., Calumet Co., Dodge Co., Door Co., Fond du Lac Co., Kenosha Co., Kewaunee Co., Manitowoc Co., Milwaukee Co., Outagamie Co., Ozaukee Co., Racine Co., Sheboygan Co., Walworth Co., Washington Co., and Waukesha Co.. Areas where Silurian bedrock occurs in Wisconsin can be identified by the most current NRCS, Wisconsin Geological Natural History Survey, department of agriculture, trade and consumer protection, department of natural resources, county maps, or infield bedrock verification methods.
Estimated costs for preliminary geophysical site evaluation.
Given that only hindsight is twenty-twenty, one may wish to have a geophysical site evaluation done. The evaluation can assist with defining a more streamlined approach and/or providing preliminary data for others to evaluate before committing to a more in-depth investigation. The following can assist with defining the level of effort needed to map bedrock or other soil conditions. By all means, one should be aware by this point that geophysical results, in part, respond to layers at depth. Physical knowledge about actual soil thickness and other geologically conditions strongly improves the interpretation. Consequently, drillers logs, boring data, or excavations play an important role in correlating the geophysical results to actual site specific conditions. Costs for drilling or other are not part of this discussion or the cost estimates provided below.
Option 1: observe the response from one to three geophysical instruments.
This option offers an approach to evaluate the responses of one to three geophysical instruments (e.g., EM, OhmMapper, and GPR*) along a pair of closely spaced parallel lines. The linear distance covered by the two lines would total less than four thousand linear feet. For one instrument the lines would each be less than two thousand feet, for two instruments less than one thousand feet, and for three instruments less than seven hundred feet in length. This option costs $ (call-currently being revised based on updates to June 2020 standards). Given the relative low cost of this option, basic plots and a limited interpretation are the deliverables. Additional post processing filters are available upon request (charges may apply). *: Depending on site conditions, GPR may yield less line coverage than estimated above.
Option 2: observe the geophysical response from various lines spacings and instruments.
This option offers one to evaluate the response of one or two geophysical instruments (EM, OhmMapper, and GPR*) over a spatially larger area. The total acreage surveyed would be less than five acres. The five-acre estimate is divided by the number of instruments that are evaluated. There are two benefits for this approach. First, this allows one to evaluate one or two geophysical instruments. Second, the data offers the ability to process with two or more line spacings. Observing the effects of variable line spacings allows one to make a better choice. It may allow one to optimize the line spacing for future services. This option costs $(call-currently being revised based on updates to June 2020 standards). Given the relative low cost of this option, basic plots and a limited interpretation are the deliverables. Additional post processing filters are available upon request (charges may apply). *:GPR may yield less line coverage than estimated above.
The cost for mapping bedrock depends on the amount of land and the amount of detail.
Costs for geophysical methods intended to map lateral variations over spatially large areas.
The following estimates are for one pass over a contiguous parcel with one instrument. This approach produces one 2D plan view presentation of the geophysical results. The cost is dependent on currently available technology and field equipment. Geophysically surveying up to an eighty-acre parcel (expecting better than eighty percent coverage) with an average distance between lines of one hundred and fifty feet costs about $(call-currently being revised based on updates to June 2020 standards). By the same token, a two hundred acre parcel (again expecting better than eighty percent coverage) may cost as little as $(call-currently being revised based on updates to June 2020 standards) with a two hundred foot average line spacing. Depending on agency requirements, one may find that a different line spacing, multiple instruments, or customized services are necessary, which will increase the cost.
Estimated costs for customized geophysical services.
Without specific objectives, it is very difficult to generalize the cost for customized geophysical services. 2D cross-sections are one type of customized service. Roughly, the cost for creating cross-sections is about $(call-currently being revised based on updates to June 2020 standards) per section, when added to a plan view survey. Without doubt, costs for customized geophysical services frequently depends on the number of methods. In addition, the amount of detail and the level of effort plays an important role. For instance, spot-checking a one thousand acre site can take less effort than geophysically surveying the entire area. On the other hand, searching for karst features, evaluating the competency of weathered bedrock, or mapping faults, fractures, and or joints can take significantly more time and money.

Glossary of Definitions and Terms for Mapping Bedrock
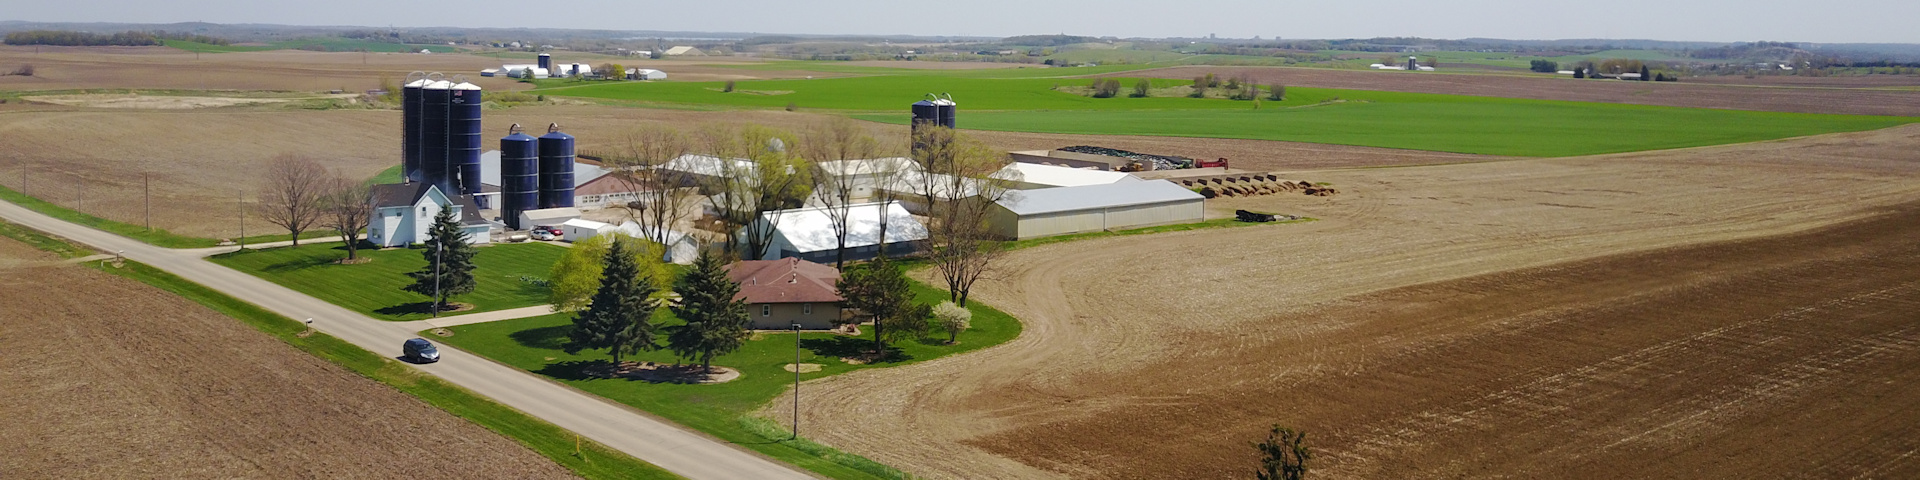
How much land is needed for a livestock nutrient management program?

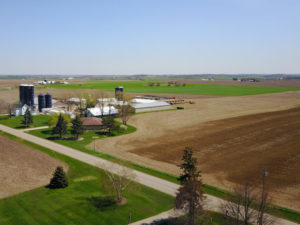
What areas benefit the most from an infield bedrock verification survey?

Summary of the HYDROGEOLOGICAL CHARACTERIZATION OF THE TOWN OF LINCOLN, KEWAUNEE COUNTY, WISCONSIN
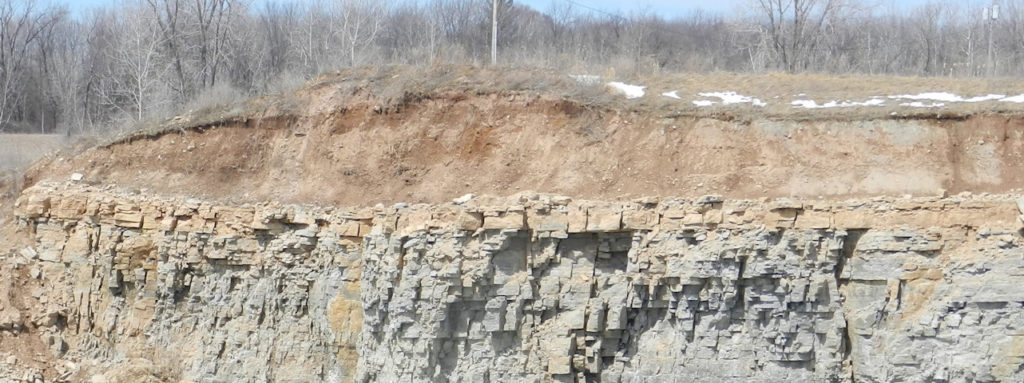
What is top of bedrock?

Geology, Groundwater, Geophysics, and WI DNR NR 151 Runoff Management Standards

A History of Groundwater Protection Past Present and Future

References and links for agricultural professionals, farmers, engineers, geologists, geophysicists,…