Geophysics for Mapping Bedrock.
Geophysics offers an approach for mapping bedrock in Wisconsin that is cost effective. More specifically, the technology is well known for determining the depth to Silurian dolomite bedrock that is less than twenty feet deep. Many geophysical methods are proven for mapping shallow and often deep bedrock. For that reason, Wisconsin’s Department of Natural Resources DNR NR 151 code includes this scientific approach as a method for infield bedrock verification. Two or more geophysical surveys combined with other more direct methods of investigation (such as walking a site, drilling, and reviewing maps) can lead to good approximations of the geologic conditions at depth. Without a doubt, the types of soils, rock conditions, geophysical approach, level of effort, and expertise contribute to good geophysical results. One of the greatest challenges for a geophysicist is picking methods that respond well. After all, the results need to agree with the known site conditions.
Wikipedia defines geophysics as a subject of natural science concerned with the physical processes and physical properties of the Earth and its surrounding space environment, and the use of quantitative methods for their analysis (link to the rest). That is to say, it takes one or more instruments, which respond well to the physical processes and properties of the Earth, to measure and explore the conditions below the surface of the ground. Geophysical methods with all of its electronics and graphics is not magic and is certainly not a crystal ball. Instruments respond to conditions at depth without personal bias. A well thought out approach combined with interpretations from people who have experience in shallow bedrock surveys offer the greatest level of confidence. A high level of confidence makes it easier for government agencies to approve the results for an infield bedrock verification program.

Define geophysics.
What can near surface geophysical methods map?
Geophysical methods require a condition or a change of state below the ground. The conditions at depth must be detectable and are dependent on the type of equipment used. In other words, geophysical methods depend on a detectable contrast and a target being large enough to create a measurable response. For near surface methods, this usually means there is an electrical contrast or a physical contrast. Physical contrasts are often easier to perceive. They frequently involve a change in materials. For example, a change from sand and gravel to clay. A more drastic change is when there is a transition from soils to rock. An electrical contrast is less obvious. It is easier to demonstrate than it is to explain. To illustrate an electrical contrast, clay rich moist soils conduct electricity far better than dry rock or dry sand and gravel. Thus, sands and gravels are often mapped in areas dominated by moist clay. Other agricultural applications are discussed at GeophysicalServices.com.
Types of soils.
While the degree of saturation plays an important role, near surface geophysical surveys commonly focus on mapping variations in soils by their grain size and degree of compaction. Some geophysical instruments respond well to changes in the amount of clay, silt, sand, and gravel. Electromagnetic and electrical resistivity instruments are a good choice since clays and silts generally conduct electricity better than larger grained materials like sand, gravel, or large rocks. Furthermore, these materials frequently vary in stiffness and how well they compact. For example, small particle size materials like clay are often not as stiff as a sand. Consequently, seismic energy or ground vibrations do not pass through poorly compacted fine grained materials as quickly as they would through a well compacted angular sand.
Types of rock.
Wisconsin has a large variety of rock types. That is Wisconsin’s bedrock may be sedimentary, metamorphic, or igneous. Rock is cemented and normally far more ridged than soils. However, bedrock also has varying electrical properties and varying degrees of stiffness, much like soils. To illustrate, competent granite is less electrically conductive than limestone. Limestone being a sedimentary rock has a different mineralogy and greater porosity, which typically makes it more conductive.
Not only can rock can be characterized by the velocity seismic energy passes through it, it can different rock conditions based on the manner it propagates along the surface. Unlike the multi-channel analysis of surface waves or MASW, Seismic refraction surveys differentiate types of rock based on the velocity body waves pass through the subsurface. MASW characterizes both soils and rock based on how a surface wave propagates across a site.
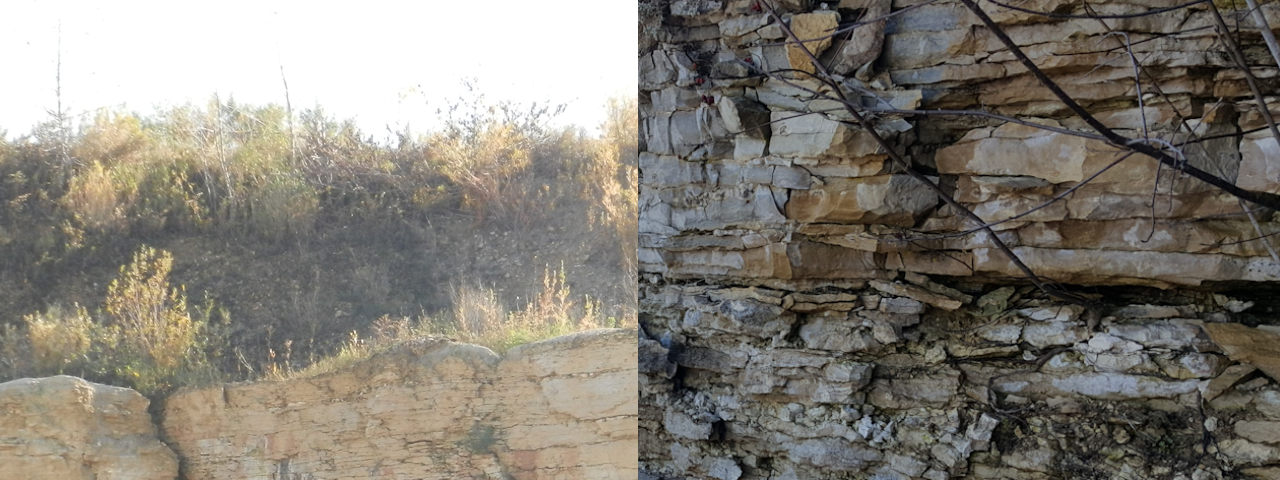
Bedrock covered by soil (left) and an example of fractured bedrock (right).
Groundwater conditions.
Groundwater plays an important role in near surface geophysical investigations. The amount of groundwater and the composition of the materials dissolved in the water or groundwater chemistry can affect the electrical and seismic properties of soils and rock. In Wisconsin, one will generally find that the degree of saturation may effect seismic properties more than the groundwater chemistry. The presence of water can increase seismic velocities. Conversely, groundwater chemistry and the degree of saturation drive electrical methods. Electrically, uncontaminated groundwater (not distilled water) conducts electricity better than most soils or rock. As a result, the presence of groundwater makes a dry soil or rock unit more conductive. While the effects of groundwater are often detectable, the materials dissolved in the groundwater play an important role. Since this page focuses on mapping bedrock, discussion about the effects of groundwater contamination are found in other portions of the site.
Geophysically mapping soils, rock, and groundwater conditions.
To summarize, variations in soils, rock, and groundwater conditions all factor in to how geophysical instruments respond. If the units are thick enough and are different enough they will influence the geophysical instrument’s measurements. Subsequently, one can then detect and or map many types of geologic conditions. Mapping variations in soils and the depth to bedrock are the objective of many geophysical surveys. This means that extreme or rapid increases in soil thickness along hundreds of feet, which may create a preferential path to an aquifer via a bedrock valley or depression, is a potential geophysical target. Given that weathering, joints, fractures, and faults lead to clay infilling and an increase in porosity, geophysical methods can assist with mapping changes in bedrock conditions. For instance, near surface karst features and preferential paths for groundwater flow can impact the electrical properties as well as the seismic velocities of geologic units at depth.
Geophysical methods for mapping near surface bedrock
Unlike drilling, geophysical surveys assist with characterizing spatially large areas. With the exception of geophysical tools designed to go down a borehole, many instruments are very portable and easily transported to remote areas. Here is a link to a chart of geophysical equipment verses applications. Drilling and geophysical borehole tools offer the most detailed information at a single point. The details shown in a boring log assists with ground truthing and correlating the geophysical results between boreholes. Though drilling logs are great, it is generally not cost effective to drill the amount of holes needed to characterize the near surface geologic conditions over large areas. It is much like figuring out the weather. For example, radar produces maps for spatially large areas and a personal weather station explains what is occurring outside your home or office.
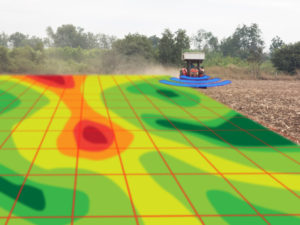
Unlike drilling, there is little to no crop damage. Surveys can be conducted most anytime of the year. Geophysical instruments are able to acquire thousands of measurements along tens or hundreds of transect lines. Data collected along transect lines are loaded into mapping software. The software contours the data and presents it in plan view or as a map. Viewing the data in this fashion, allows one to visualize how conditions at an average depth vary across a site. Though cost effective over large areas, there is little vertical detail in this approach. If greater vertical detail is of interest, then one may consider acquiring geophysical data in a manner that will produce cross sectional views of the local geology. This approach works well for mapping variations in geologic conditions with a fair amount of detail between two boreholes or areas of concerned identified in a plan view map.
Electromagnetic terrain conductivity instruments.
Electromagnetic or EM instruments are cost effective for mapping bedrock. A Geonics EM38, EM31 short, EM31 normal, or an EM34 are able to reach depths from as shallow as one foot to as deep as about 200 feet. These instruments are very mobile and capable of characterizing very large plots of land in a relatively short period of time. In my opinion, these instruments are the cornerstone of the near surface EM industry. Geonics Ltd released their first EM31 in 1976. They continue to demonstrate their commitment to developing quality instruments. People familiar with the agricultural industry are very familiar with the EM38 and its contribution to soil management.
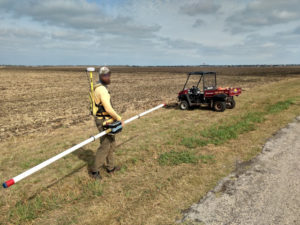
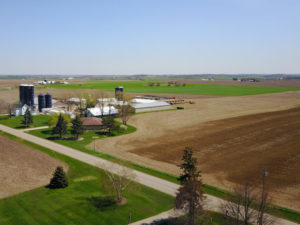
Mapping a farm field with a Geonics EM31.
Which Geonics equipment is best suited for mapping shallow Silurian bedrock for Wisconsin’s NR 151’s infield bedrock verification program?
The code identifies several depths of concern. It effectively narrows the selection of Geonics instruments to ones that respond to less than about twenty feet. While an EM34 in a horizontal dipole mode has a depth of investigation of about twenty-five feet, it is not well suited for very shallow depths. Conversely, a Geonics EM38 has a maximum apparent depth of penetration of less than about five feet. Because one generally needs to observe the response deeper than the maximum depth of concern, an EM38 is likely best for depths down to about four feet. This leaves the EM31 short and EM31 normal for mapping soils and bedrock between about five and twenty feet. By all means, these are not absolute depths. The apparent depth of investigation is dependent on how well the soils and rock conduct electricity, as well as, the elevation of the instrument above the ground.
Electrical resistivity methods.
Electrical resistivity and electromagnetic conductivity are very similar. Resistivity is better at measuring low to very low apparent conductivities or materials that are electrically resistive. When electrical resistivity increases the electrical conductivity decreases. That is to say, electrical resistivity is inversely proportional to electrical conductivity. Geophysically, resistivity data uses the units of ohm*feet or ohm*meters. Whereas, electrical conductivity uses the units of mmhos/m or mS/m, which is 1/1000th of an ohm*m. Why is this worth discussing? Because much of the discussion about electrical resistivity and electromagnetic responses overlap. One addresses conductivity and the other resistivity. Nonetheless, the technologies are very different. EM methods create a magnetic field that oscillates at a specific frequency for various instruments and depths of investigation. To reduce the effects of charge buildup, DC resistivity usually reverses polarity on the order of seconds, which is not the same as EM.
DC electrical resistivity imaging or tomography.
Electrical resistivity or ER is very good at creating cross-sectional images of the earth to hundreds of feet. It is similar to digging a long trench and taking a photograph of the sidewall. However, you do not need a trench. By placing 84 or so electrodes at a predetermined distance, one can program a higher end resistivity meter (AGI’s SuperSting or ABEM’s Terraloc) to acquire thousands of readings. While fewer electrodes may take less time and effort, vertical resolution, horizontal resolution, and the depth of investigation are more limited. The instrument acquires measurements that respond to changes in conditions with increasing depth. Afterwards, post-processing software generates an image of the unit resistivity values as a function of depth. The plot is a representation of the geology. For bedrock mapping, it assists with characterizing the soil thickness, type of soils, and possibly condition of the bedrock.
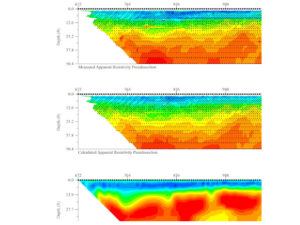
Electrical resistivity imaging to more than 40 feet deep.
Capacitance coupled electrical resistivity 1-D and 2-D imaging or tomography.
Unlike DC resistivity methods, a Geometrics OhmMapper capacitance coupled electrical resistivity system does not use electrodes. However, it is in direct contact with the soil, since it is towed along the ground. The OhmMapper is very flexible. One can configure it to respond to one average depth of penetration or configure it for multiple depths of investigation to create a cross-section. When setup for a single average depth of penetration, it can acquire thousands of readings along any number of parallel lines. The lines do not need to be parallel, if GPS is part of the system. This approach is very good at mapping variations across a site, much like EM methods.
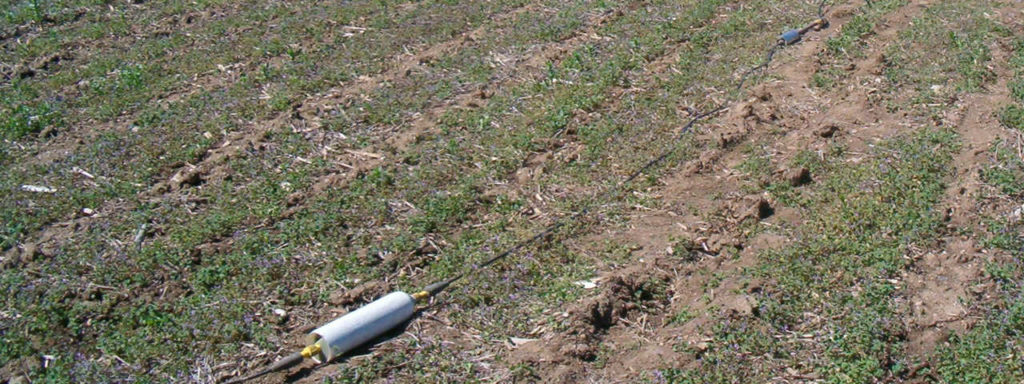
OhmMapper capacitance coupled towed array.
In Wisconsin, the system may reach depths of approximately fifty feet. The ability to reach greater depths is important if one desires cross-sections. To create a cross-section using an OhmMapper, one simple configures the system for multiple depths of penetration. Like DC resistivity methods, the data is then processed to create a two dimensional or 2-D representation of the geology at depth. Lines from more depths of penetration leads to a great level of confidence. It is important to note that cross-sections are not available from a single OhmMapper transect line.
Seismic refraction and multi-channel analysis of surface waves or MASW.
Seismic refraction is one of the more well known methods for mapping bedrock or soil thickness. The method, like electrical resistivity imaging, produces a cross-section. The seismic refraction cross-section represents average unit p-wave velocities as a function of depth. A Geometrics Geode with 24 or 48 geophones is capable of mapping soil thickness to depths much greater than twenty feet. However, problems can occur with perched water and/or when seismic velocities decrease with depth. In areas with highly weathered rock, the refraction survey may yield a depth to bedrock that is below the top of shallowest occurrence of rock. The degree of weathering or the thickness of the weathered rock may not appear in the cross-section. Drilling or excavations can assist with correlating the refraction results.
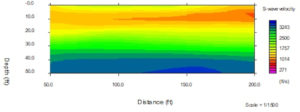
MASW seismic image of soil thickness for mapping bedrock.
A second practical seismic method is the multi-channel analysis of surface waves or MASW. In comparison to seismic refraction, MASW is not significantly impacted by groundwater. Unlike passive seismic methods, shallow MASW surveys use a hammer source and many geophones, which greatly increase resolution. MASW data collected with a land streamer (a tow strap fitted with geophones), can cover thousands of feet along a straight line. The spacing between the geophones and the distance between collection points drives the cost and resolution of the MASW survey. MASW produces a cross-section of shear wave velocities as a function of depth. The benefit of knowing shear wave velocities is that an increase in velocity correlates to an increase in stiffness or rigidness of the material. For bedrock mapping, this means that locating zones with higher shear wave velocities assists with locating more competent or solid bedrock.
Ground penetrating radar.
Without doubt, when ground penetrating radar or GPR responds well the images are spectacular. If GPR worked well for all soil conditions, we may not need any other geophysical method for mapping shallow bedrock. However, this is not the case. GPR has issues with loosing penetration in electrically conductive soils. While one can attempt to predict how well it will work, it is easier to collect some GPR records and see how well they correlate to known conditions. Water (not ice or snow) is an issue, since it increases the electrical conductivity of the soil. A second issue that is more difficult to predict are the effects of poorly graded soils, boulders, and/or highly fractured rock. Large chunks of rock can cause the GPR’s signal to disperse or reflect off towards many directions. Thus, a clear interface between the soils and rock may be difficult to interpret.
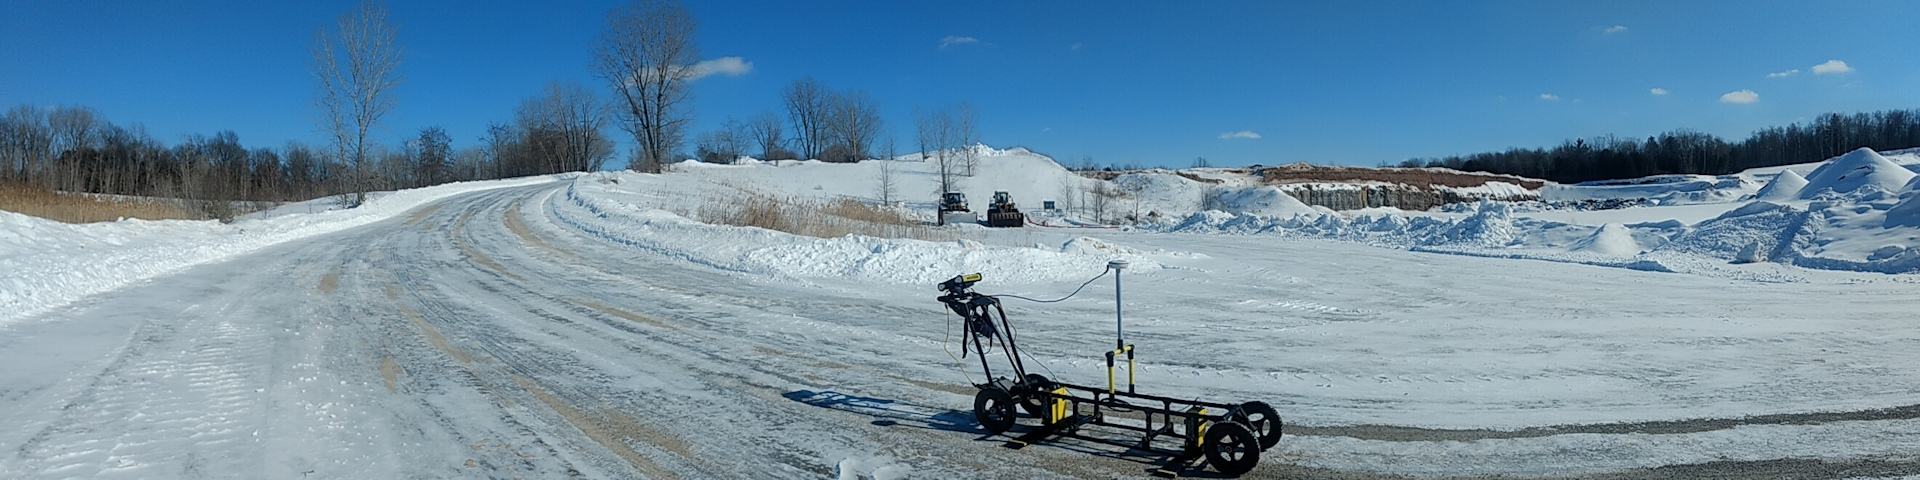
Sensors & Software pulseEKKO Ultra receiver with 100 MHz antennas and GPS.
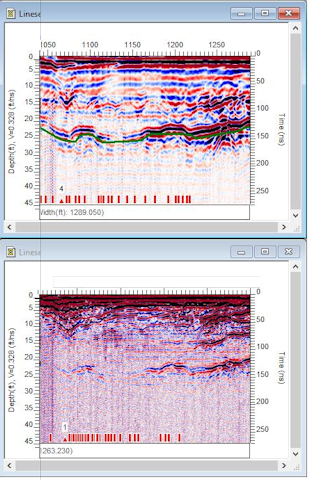
GPR image of depth to bedrock with 50 MHz and 100 MHz antennas.
Although site specific, GPR may be an excellent choice. When mapping bedrock, one is attempting to map a large flat lying feature. In contrast with detecting voids or locating buried pipes and cables, mapping bedrock does not require high resolution. Thus, lower frequency GPR antennas are an appropriate choice. GPR systems with frequencies above 200 MHz, for mapping buried utilities, may not respond well. Sensors & Software released an Ultra receiver in late 2018 for the pulseEKKO Pro GPR system that is great for geological investigations. It is highly configurable and I have reached depths greater than thirty feet in the Green Bay, WI area. This system utilizes 50 MHz, 100 MHz, or 200 MHz GPR antennas. The lower frequency antennas offer greater depths of investigation with lower resolution. In contrast, higher frequency antennas offer greater resolution and are more easily maneuvered through rough terrain.
Geophysical borehole methods
When geophysically mapping or characterizing bedrock, one needs to discuss borehole methods. Withouta doubt, one will need a borehole. However, the results from drilling a hole into the soils and then into bedrock does not always provide all the answers. There are times when one needs confirmation or a better description. In those cases, there is a suite of borehole tools that may be of great assistance. Below is a list of tools that may provide addition detail not found in a drillers log.
Borehole tools that are restricted to conditions within the borehole
This suite of tools respond to conditions within the borehole. In general, they do not penetrate into the formation.
Optical Borehole Imager or OBI produces an clear, sharp, 360° continuous- unwrapped digital picture of the borehole wall, either in air or clear water.
Acoustic Televiewer Imager records a 360°unwrapped and 3D image of the borehole wall using an ultrasonic beam.
Fluid Conductivity and Temperature are self explanatory.
3 Arm Caliper measures the borehole diameter while coming up the hole.
Impeller Spinner Flowmeter measures impeller rotation caused by groundwater flow in the borehole.
Heat Pulse Flowmeter measures low flow rates in the borehole environment.
Deviation probe measures the direction relative to magnetic north, inclination and trajectory of the borehole.
Borehole tools that respond to conditions beyond the borehole
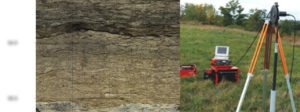
Image of the inside of a borehole using an optical borehole imager (left) and a Geonics EM39 (right).
These tools respond to the formation or conditions beyond the borehole wall. They may assist with characterizing bed boundaries, facies changes, identify hydrostratigraphic units, aquifer thickness, water quality, soil horizons, and grain size estimation. Geonics EM39 borehole induction tool, natural gamma, spontaneous potential (SP), single point resistance (SPR), normal electrical resistivity probe, full waveform sonic, and finally a Ballard source with Geostuff geophones.

Good nutrient management practices produce better crops and protects the groundwater.

Glossary of Definitions and Terms for Mapping Bedrock
How much land is needed for a livestock nutrient management program?

What areas benefit the most from an infield bedrock verification survey?

Summary of the HYDROGEOLOGICAL CHARACTERIZATION OF THE TOWN OF LINCOLN, KEWAUNEE COUNTY, WISCONSIN
What is top of bedrock?

Geology, Groundwater, Geophysics, and WI DNR NR 151 Runoff Management Standards

A History of Groundwater Protection Past Present and Future

References and links for agricultural professionals, farmers, engineers, geologists, geophysicists,…